Finnish resident’s have more foreign assets than foreign liabilitiesStatistics on foreign assets in their current form date back to 1975; ever since then, Finnish residents have had more in foreign liabilities than foreign assets. In April 2010 Finland’s net international investment position turned positive for the first time. At the end of October 2010 Finnish resident’s foreign assets exceeded their foreign liabilities by about EUR 10 bn. This change was attributable to several factors, but primarily to equity capital-related items1.
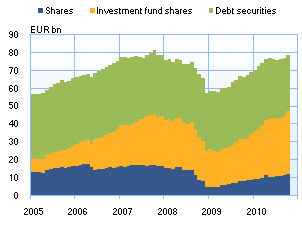
Non-financial corporations’ foreign liabilities related to shares contracted by about EUR 73 bn between the start of 2008 and October 2010. The contraction is largely attributable to a fall in share prices, but also partly to real sales of shares. Non-financial corporations’ total foreign liabilities decreased in the same period by about EUR 68 bn. In recent months, employment pension funds’ 2 foreign assets have returned to the level prevailing prior to the financial crisis. Foreign investment in this sector consists almost entirely of portfolio investment. Looking at the various investment instruments, investment fund shares and debt securities each account for about 40% of the portfolio investment stock, and shares comprise the remaining portion of nearly 20%. Employment pension funds have clearly changed their investment strategy by increasing the portion of investment fund shares in their portfolios.
|
Finland's net international investment position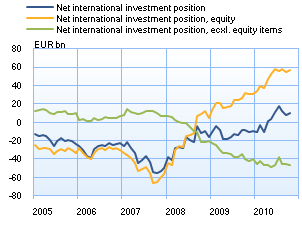 |
Excluding equity items, Finland’s net international investment position is negativeExcluding equity items, Finland’s net international investment position began to contract at the start of 2008 and turned negative in the second quarter of 2008. Since then, liabilities have expanded faster than assets, and at the end of October 2010 net liabilities amounted to about EUR 47 bn.
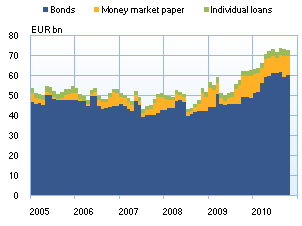
The central government’s net external debt has increased since the start of 2008 by EUR 21 bn, which is 40% of its total accumulation of liabilities. The corporate sector is also responsible for much of the growth in liabilities. Large international groups have reorganised their internal financing by converting intragroup loans into equity capital, which has translated into a EUR 12 bn rise in Finnish non-financial corporations’ net liabilities. At the same time, corporations have taken out more foreign loans outside the groups, in the amount of about EUR 9 bn, in the form of both debt securities and individual loans.
Monetary financial institutions’ net foreign liabilities, excluding equity items, have also increased. This is been attributable to the rise in deposit liabilities.
|
Foreign securities-based assets
|
Trade account surplus increased to over EUR 1 bn in October due to the delivery of a cruise shipOwing to the delivery of a cruise ship of EUR 1 bn in October, the trade account surplus (in BOP terms) rose to almost EUR 1.6 bn. Exports increased by about a sixth and imports by almost a fifth compared to October 2009. In October 2010 the current account posted a surplus of EUR 2 bn, the same as a year earlier.
1 Equity capital includes portfolio investment shares and investment fund shares, and direct investment shares, participations and reinvested earnings.
2 In BOP statistics, the State Pension Fund (VER) has been moved from the central government sector to employment pension funds as of the start of 2010. However, in this data, VER is included in employment pension funds also for 2005−2009. |
Central government's foreign debt |
Finland's balance of payments
The statistics become final more than two years after the end of the reference year.
Year 2009, EUR million |
September 2010, EUR million |
October 2010, EUR million |
12 month moving sum, EUR million | |
| Current account | 4,696 | 439 | 2,024 | 4,921 |
| Goods | 3,395 | 110 | 1,561 | 3,352 |
| Services | 1,329 | 89 | 271 | 1,766 |
| Income | 1,661 | 360 | 323 | 1,503 |
| Transfers | -1,689 | -120 | -131 | -1,700 |
| Capital account | 145 | 12 | 12 | 145 |
| Financial account | 11,011 | 1,676 | -229 | -381 |
| Direct investment | -2,762 | -28 | -502 | -3,679 |
| Portfolio investment | -513 | -931 | 2,908 | -556 |
| Other investment | 12,669 | 2,011 | -2,439 | 3,759 |
| Reserve assets | -614 | 94 | -75 | 716 |
| Financial derivatives | 2,231 | 529 | -121 | -622 |
| Errors and omissions | -15,852 | -2,127 | -1,808 | -4,685 |
More information
Jaakko Suni tel. +358 10 831 2454, email firstname.surname(at)bof.fi