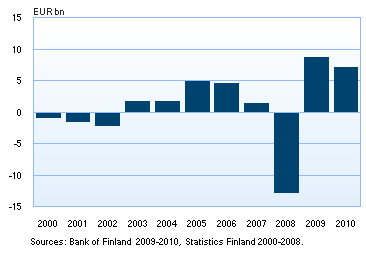
Investment funds reported profits of EUR 7.1 billion for 2010Investment funds registered in Finland reported total profits of EUR 7.1 billion for the financial year 2010. Of domestic investment funds, as much as 91 % recorded positive results1. Strong profits reflected continuing favourable developments in the securities markets. Even so, the aggregate profit of investment funds for 2010 was EUR 1.6 billion less than the record profit posted in 2009 (EUR 8.7 billion). | ||||||||||||||||||||||||||||||||||||||||||||||||||||||||||||||||||||||||||||||||||||||||||||||||||||||||||||||||||||||||||||||||||||||||||||||||||||||||||||||||||||||||||||||||||||||||||||||||||||||||||||||||||||||||||||||||||||||||||||||||||||||||||||||||||||||
|---|---|---|---|---|---|---|---|---|---|---|---|---|---|---|---|---|---|---|---|---|---|---|---|---|---|---|---|---|---|---|---|---|---|---|---|---|---|---|---|---|---|---|---|---|---|---|---|---|---|---|---|---|---|---|---|---|---|---|---|---|---|---|---|---|---|---|---|---|---|---|---|---|---|---|---|---|---|---|---|---|---|---|---|---|---|---|---|---|---|---|---|---|---|---|---|---|---|---|---|---|---|---|---|---|---|---|---|---|---|---|---|---|---|---|---|---|---|---|---|---|---|---|---|---|---|---|---|---|---|---|---|---|---|---|---|---|---|---|---|---|---|---|---|---|---|---|---|---|---|---|---|---|---|---|---|---|---|---|---|---|---|---|---|---|---|---|---|---|---|---|---|---|---|---|---|---|---|---|---|---|---|---|---|---|---|---|---|---|---|---|---|---|---|---|---|---|---|---|---|---|---|---|---|---|---|---|---|---|---|---|---|---|---|---|---|---|---|---|---|---|---|---|---|---|---|---|---|---|---|---|---|---|---|---|---|---|---|---|---|---|---|---|---|---|---|---|---|---|---|---|---|---|---|---|---|---|---|---|---|---|---|---|
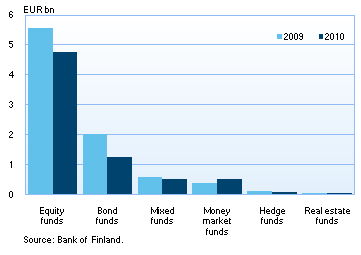
Every fund category reported profits for the financial year under review2, but only money market funds posted higher total profits than in 2009. Equity funds’ share of the aggregate profit of investment funds was still by far the largest, totalling EUR 4.8 billion. Equity funds also led the fund categories in 2010 in terms of fund assets. The profits of bond funds amounted to EUR 1.2 billion; for mixed funds the total was EUR 0.5 billion. Investment fund profits mainly comprised capital gains from securities transactions and unrealised value appreciation of securities holdings3. In the course of 2010, investment funds recorded EUR 5.1 billion worth of capital gains and EUR 2.8 billion worth of capital losses, resulting in a positive net contribution of EUR 2.4 billion to total profits from securities transactions. Unrealised value appreciation for securities holdings was reported at EUR 4.0 billion. The bulk of dividend income from shares and income from fund shares received by investment funds (EUR 521 million) went to equity funds. Overall dividend income from shares and income from fund shares increased by EUR 124 million, due mainly to an increase in the shareholdings of investment funds. Of interest income (EUR 790 million), the bulk was recorded by bond funds and money market funds. |
Net profit of investment funds, 2000-2010 Investment fund profits by fund type, 2009-2010 | |||||||||||||||||||||||||||||||||||||||||||||||||||||||||||||||||||||||||||||||||||||||||||||||||||||||||||||||||||||||||||||||||||||||||||||||||||||||||||||||||||||||||||||||||||||||||||||||||||||||||||||||||||||||||||||||||||||||||||||||||||||||||||||||||||||
By contrast, the result for the financial year was impaired by the fact that income from derivatives contracts turned into a loss of EUR 153 million and fees paid to fund management companies and custodians increased. Fees paid in 2010 totalled EUR 592 million, compared to EUR 417 million in 2009. The item is composed mainly of administrative fees paid to fund management companies. In the course of 2010, the total assets of investment funds grew by 14 % to EUR 62.2 billion. The EUR 7.6 billion growth in total assets was almost entirely due to profits for the financial year. There was only EUR 0.6 billion worth of net inflows of new capital from investors into domestic investment funds4. Investment funds distributed profits of EUR 138 million to their shareholders.
At the end of 2010, there were 510 operating investment funds registered in Finland, administered by 34 fund management companies.
The Bank of Finland annually publishes a statistical release ‘Financial statements of investment funds’. The data are collected directly from investment funds registered in Finland. The publication also relies on data derived from monthly balance sheet reporting by investment funds to the Bank of Finland. 1 At the end of 2010, there were 510 operating investment funds registered in Finland, of which 465 reported positive results for the financial year. In 2009, 92 % of investment funds had reported positive results. 2 According to the Guideline of the European Central Bank (ECB/2007/9), investment funds are statistically classified into six different types: equity funds, bond funds, mixed funds, hedge funds, real estate funds and money market funds. 3 Of investment fund profits, 80 % consisted of net income from securities (84 % in 2009). Between fund categories, however, there are differences due to investment strategies. For bond funds and money market funds, for example, the relative share of net income from securities is smaller and that of interest income larger. 4 In the financial statements of investment funds statistics, subscriptions of investment fund shares include smaller adjustments due to other changes. Source: Financial statements of investment funds 2010, Bank of Finland. | ||||||||||||||||||||||||||||||||||||||||||||||||||||||||||||||||||||||||||||||||||||||||||||||||||||||||||||||||||||||||||||||||||||||||||||||||||||||||||||||||||||||||||||||||||||||||||||||||||||||||||||||||||||||||||||||||||||||||||||||||||||||||||||||||||||||
Income statement items for investment funds registered in Finland, by fund type, 2010,
| ||||||||||||||||||||||||||||||||||||||||||||||||||||||||||||||||||||||||||||||||||||||||||||||||||||||||||||||||||||||||||||||||||||||||||||||||||||||||||||||||||||||||||||||||||||||||||||||||||||||||||||||||||||||||||||||||||||||||||||||||||||||||||||||||||||||
 Financial statements of investment funds, 2010 and key figures 1995–2010.xls
Equity funds |
Bond funds | Mixed funds | Real estate funds | Hedge funds | Investment funds total | Money market funds | Total | |
| RETURNS AND REVALUATIONS | 5 243 | 1 410 | 581 | 28 | 112 | 7 375 | 540 | 7 915 |
| Net income from securities | 4 528 | 853 | 524 | 23 | 77 | 6 005 | 346 | 6 351 |
| Capital gains | 2 661 | 959 | 235 | 5 | 1 009 | 4 869 | 279 | 5 148 |
| Capital losses | -1 092 | -409 | -90 | -13 | -967 | -2 572 | -189 | -2 761 |
| Unrealised value changes | 2 959 | 303 | 378 | 32 | 36 | 3 708 | 257 | 3 964 |
| Net income from derivative contracts | -23 | -90 | -38 | -1 | 0 | -152 | -1 | -153 |
| Capital gains | 494 | 453 | 266 | 1 | 294 | 1 508 | 3 | 1 511 |
| Capital losses | -524 | -561 | -309 | -2 | -305 | -1 702 | -4 | -1 706 |
| Unrealised value changes | 8 | 18 | 5 | 0 | 11 | 42 | 0 | 42 |
| Dividend income and income from fund shares | 468 | 5 | 36 | 5 | 7 | 521 | 0 | 521 |
| Interest income | 7 | 541 | 32 | 0 | 21 | 601 | 189 | 790 |
| Other income | 264 | 101 | 27 | 1 | 6 | 400 | 6 | 406 |
| EXPENSES | -490 | -168 | -50 | -2 | -33 | -743 | -39 | -782 |
| Fees1 | -369 | -122 | -44 | -2 | -18 | -554 | -38 | -592 |
| Other expenses2 | -120 | -46 | -7 | 0 | -15 | -188 | -1 | -190 |
| NET PROFIT / LOSS FOR THE FINANCIAL YEAR | 4 754 | 1 242 | 531 | 26 | 80 | 6 632 | 500 | 7 133 |
Balance sheet items for investment funds registered in Finland, by fund type, 2010, EUR m
Equity funds |
Bond funds | Mixed funds |
Real estate funds | Hedge funds | Investment funds total |
Money market funds | Total | |
| TOTAL ASSETS | 25 616 | 20 587 | 4 851 | 156 | 1 651 | 52 862 | 10 295 | 63 157 |
| Securities at market value | 24 721 | 19 496 | 4 591 | 151 | 1 083 | 50 042 | 9 948 | 59 990 |
| Receivables3 | 895 | 1 091 | 261 | 5 | 569 | 2 820 | 346 | 3 167 |
| TOTAL LIABILITIES | 25 616 | 20 587 | 4 851 | 156 | 1 651 | 52 862 | 10 295 | 63 157 |
| Fund value 31 Dec | 25 384 | 20 322 | 4 836 | 156 | 1 308 | 52 006 | 10 218 | 62 223 |
| Net profit / loss for the financial year | 4 754 | 1 242 | 531 | 26 | 80 | 6 632 | 500 | 7 133 |
| Profit distribution | -39 | -81 | -7 | -1 | -1 | -129 | -9 | -138 |
| Redemptions of IF shares | -11 415 | -11 415 | -955 | -37 | -1 116 | -24 937 | -12 905 | -37 843 |
| Subscriptions of IF shares4 | 12 383 | 13 279 | 1 192 | 32 | 654 | 27 540 | 10 910 | 38 450 |
| Fund value 1 Jan | 19 701 | 17 297 | 4 075 | 135 | 1 692 | 42 899 | 11 722 | 54 622 |
| Current liabilities5 | 232 | 265 | 16 | 1 | 344 | 856 | 77 | 933 |
2 includes interest expenses and other expenses
3 includes accounts receivable, other receivables, accrued income, as well as cash and bank deposits