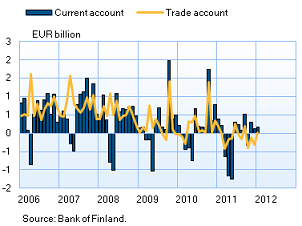
Finland's current account moved into deficit in 2011 for the first time since 1993The current account posted a deficit of EUR 1.3 billion in 2011, compared to a surplus of EUR 2.8 billion a year earlier. In BOP terms, there was a deficit of more than EUR 1.1 billion on goods, and the surplus of EUR 0.9 billion on services did not suffice to shift the current account into surplus. Current account receipts increased by just under 4% and expenditures by 8% on the previous year, whereas in 2010 there had been an annual increase of 13% and 15% in receipts and expenditures, respectively. The current account to GDP ratio in 2011 was just under -1%, compared to 1.4% in the previous year. The current account had last posted a deficit in annual terms in 1993. In the meantime, there have annually been some months with current account deficits, when in April–May Finnish companies have paid dividends abroad. The situation started to deteriorate as early as 2009, but it was not until 2011 that the BOP goods account turned negative1. Finland's goods account posted a deficit in almost all months in 2011, but the most important deficit was recorded in the last quarter of the year. The goods account had last posted a deficit in 1989. The reason for the deficit is slower export growth: goods exports increased by 8% on the previous year, compared to an increase of 16% a year ago. Imports, in turn, grew by 16%, compared to just under 19% in the previous year. Import growth was largely due to the higher crude oil price. The most important export and import countries2 for Finland were Sweden, Germany and Russia, as before. They accounted for almost a third of aggregate BOP goods exports and nearly half of imports in 2011. These main countries' shares have not changed significantly in recent years. Not even the services surplus, which quadrupled on the previous year to EUR 0.9 billion, could shift the current account into surplus in 2011. The services account had showed a deficit since the beginning of the 1980s, until it posted a surplus first in 2004 and then permanently in 2007. Surplus growth in 2011 is explained by a larger contraction in services imports (9%) than in services exports (6%). The share of services in current account receipts and expenditures has declined since the record year of 2009, when services accounted for a quarter of both receipts and expenditures. In 2011, the share of both receipts and expenditures was a fifth of aggregate current account receipts and expenditures. Overall, the services surplus was attributable to information technology services as well as, royalties and licence fees, which doubled their surpluses. The largest item in services receipts and expenditures was other business services, accounting for 29% of total services exports and for 39% of total services imports. Of services items, the deficit on transports increased in 2011, as transport imports – closely related to goods imports – increased and transport exports declined on the previous year. Other services items showing deficits included tourism, communications and insurance services, other business services and cultural services. The main destination countries for Finnish services exports in 2011 were Russia, Sweden, the United States and Germany. Combined services exports to these four countries accounted for more than 30% of Finland's aggregate services exports. The United States and Russia improved their rankings in the top team on the previous year. Finland's tourism receipts from Russia increased by more than 50% from a year ago. The highest services expenditures, in turn, were related to Germany, Sweden, the United States and the United Kingdom, which together accounted for 42% of the total. The same group of countries has already topped the list in many consecutive years. Tourism expenditures were mainly related to Estonia, Spain and Sweden, as in the previous year. 1 The data under 'Goods' in the balance of payments statistics differ from the National Board of Customs' foreign trade statistics. Freight and insurance costs, which appear in BOP service expenditures, are deducted from the National Board of Customs' cif-based goods imports. Goods produced in ports, including eg fuel, are added to both imports and exports. 2 In the balance of payments goods statistics by country, exports are classified according to the country of destination, imports from the EU region according to the country of dispatch and imports from outside the EU according to the country of origin. |
 |
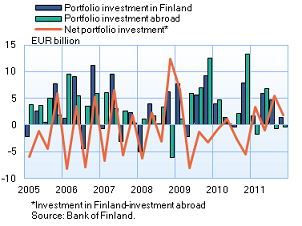
Portfolio investments inflows remaind brisk, while outflows declined substantiallyNearly EUR 20 billion worth of Finnish bonds, in net terms, were sold to foreign investors. Bonds issued by the Finnish government and Finnish MFIs were both sold to the value of just under EUR 10 billion. Net inflows in portfolio investment amounted to almost EUR 10 billion in 2011. Accordingly, net investment flows were reversed compared to the previous year, which recorded outflows of just under EUR 8 billion. The main reason for the change was that investments by Finnish residents in foreign securities remained at slightly more than EUR 4 billion, which was EUR 16 billion less than a year ago. Portfolio investment inflows were almost exclusively related to debt instruments, which were sold abroad to the value of approximately EUR 14 billion in net terms. Sales of long-term bonds amounted to EUR 20 billion. This was almost evenly divided between bonds issued by the Finnish government and bonds issued by Finnish MFIs, which were both sold to the value of just under EUR 10 billion in net terms. By contrast, short-term money market instruments were repurchased and redeemed in the amount of EUR 6 billion, of which treasury bills accounted for nearly EUR 4 billion. Finnish companies’ shares were returned to Finland to the value of EUR 1.6 billion. Meanwhile, EUR 1.1 billion worth of shares of investment funds registered in Finland (incl. money market funds) were sold abroad. At the end of 2011, the market value of the stock of inward portfolio investment was EUR 218 billion. The instruments were for the most part invested in Finnish bonds, whose market value stood at EUR 138 billion, ie a good 63% of the value of the investment stock. Of this, in turn, bonds issued by the Finnish government accounted for about 54%. The bulk of foreign securities acquired by Finnish investors were composed of long-term debt instruments, which were purchased for a total net amount of EUR 8.3 billion. The domestic banking sector accounted for EUR 6.5 billion of these net investments, while the share of employment pension funds and other social security funds amounted to EUR 1.7 billion. On the other hand, investments in short-term debt instruments declined by EUR 1.7 billion, mainly on account of Finnish government operations. Holdings of foreign shares also fell, as they were resold abroad in the amount of EUR 3.7 billion. Particularly employment pension funds and other social security funds as well as investment funds registered in Finland (excl. money market funds) reduced their shareholdings, by EUR 2 billion and EUR 1.5 billion, respectively. By contrast, EUR 1.2 billion worth of investments were recorded for shares of investment funds registered abroad. The market value of outward portfolio investment was EUR 208 billion at the end of 2011. Viewed by investor sector, the largest securities holdings were recorded for employment pension funds and other social security funds, which had EUR 82 billion worth of foreign securities, ie 39% of the aggregate value of the investment stock. The MFI sector accounted for EUR 64 billion (31%) of the investment stock. |
 |
No signs of recovery in inward direct investmentsThe flow of direct investment into Finland in 2008–2011 remained markedly lower than in previous years. According to preliminary data, Finland's direct investment inflows remained at EUR 0.04 billion in 2011. This low level of investment inflow is explained, on the one hand, by foreign investors' modest capital input in Finland and, on the other hand, by repatriations of capital. Compared to 2010, direct investment inflows contracted by approximately EUR 5 billion. Preliminary data indicate that Finland's direct investment outflows amounted to EUR 3.9 billion in 2011. This is about EUR 1 billion more than the average of 2002–2007, but clearly less than in 2010, when an outflow of EUR 7.9 billion was recorded. Investment flows to and from Finland in the 2010 statistics were to an exceptionally high degree boosted by pass-through investments, in which a Finnish direct investment enterprise receives capital from a foreign direct investor and then immediately invests this capital further in its own direct investment enterprises abroad. According to the Bank of Finland's estimate, investments of this type increased Finland's inward and outward flows by approximately EUR 3.7 billion in 2010 and by approximately EUR 0.6 billion in 2011. Adjusted for data on capital flows through Finland, the statistics indicate that Finland's direct investment inflows have remained notably lower in recent years than previously. On average, calculated in this manner, there were practically no direct investment inflows in 2008–2011. |
 |
Finland's balance of payments, January 2011The current account posted a surplus of EUR 0.2 billion, which is EUR 0.2 billion less than a year earlier.
Investment was inward on net, in the amount of EUR 6.6 billion.
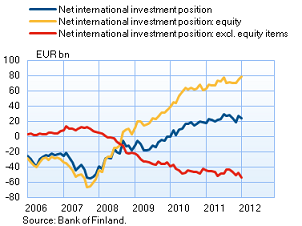
Foreign assets exceeded foreign liabilities by EUR 24 billion at the end of January 2012.
|
 |
| Year 2011, EUR million |
December 2011, EUR million |
January 2012, EUR million |
12 month moving sum, EUR million | |
| Current account | -1,272 | 125 | 172 | -1,493 |
| Goods | -1,115 | -308 | 6 | -1,300 |
| Services | 926 | 280 | 97 | 948 |
| Income | 552 | 256 | 220 | 494 |
| Current transfers | -1,636 | -102 | -150 | -1,636 |
| Capital account | 178 | 15 | 13 | 177 |
| Financial account | 9,504 | -3,041 | 6,639 | 15,746 |
| Direct investment | -3,858 | -557 | 455 | -2,888 |
| Portfolio investment | 9,614 | -8,080 | 1,210 | 12,040 |
| Other investment | 3,445 | 5,298 | 4,769 | 5,357 |
| Reserve assets | -320 | 209 | -196 | 165 |
| Financial derivatives | 623 | 89 | 400 | 1,072 |
| Errors and omissions | -8,410 | 2,901 | -6,824 | -14,430 |
More information Maria Huhtaniska-Montiel tel. +358 10 831 2534, and Anne Turkkila tel. +358 10 831 2175, email firstname.lastname(at)bof.fi
The next balance of payments bulletin will be published at 10.00 am on 13 April 2012.