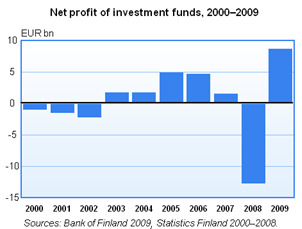
Investment funds reported a profit of EUR 8.7 billion for 2009
 Investment funds registered in Finland reported total profits of EUR 8.7 billion for the financial year 2009. This was mainly composed of net income from securities, in the amount of EUR 7.8 billion. The high level of net income from securities was due largely to the strong global stock market rally that began in March 2009. In 2008, investment funds posted a loss of EUR 12.7 billion, which was correspondingly due to a sharp decline in share prices.
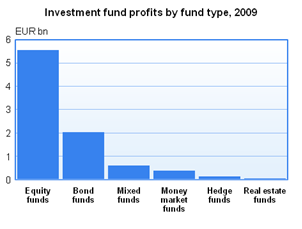
 Every fund category reported profits for the financial year under review1. Equity funds’ share of the aggregate profit of investment funds was by far the largest, totalling EUR 5.6 billion. Equity funds also led the fund categories in terms of fund assets at the end of 2009. The profits of bond funds amounted to EUR 2.0 billion; for mixed funds the total was EUR 0.6 billion. Investment funds earned aggregate interest income of EUR 809 million, which is 43% less than in 2008. Bond funds and money market funds accounted respectively for EUR 488 million and EUR 237 million of the interest income. Domestic investment funds received EUR 397 million worth of dividend income from shares and income from fund shares. Most of this income went to equity funds, whose portfolios are almost entirely made up of shares and fund shares.
Expenses recorded by investment funds amounted to EUR 555 million in 2009. Of this, EUR 417 million comprised fees paid to fund management companies and custodians. Fees paid in 2008 were slightly higher, at EUR 481 million.
In the course of 2009, the total assets of investment funds grew by 31% to EUR 54.5 billion. The nearly EUR 13 billion growth in total assets was due, in addition to value appreciation, to inflows into domestic investment funds during the year. Purchases and redemptions of investment fund shares resulted in a positive net contribution of EUR 4.2 billion. Net purchases were negative in 2009 only for hedge funds and money market funds.
At the end of 2009, there were 488 operating investment funds registered in Finland, administered by 32 fund management companies. Equity funds accounted for 36% of the total assets of domestic investment funds at the end of 2009. Bond funds, money market funds and mixed funds represented respectively 32%, 21% and 7% of the total. Hedge funds and real estate funds together accounted for 3% of the total assets.
The Bank of Finland annually publishes a statistical release ‘Financial statements of investment funds’. The data are collected directly from investment funds registered in Finland. The publication also relies on data derived from monthly balance sheet reporting by investment funds to the Bank of Finland. The statistics based on financial statements of investment funds are used mainly for compiling financial, balance of payments and other economic statistics at the Bank of Finland and Statistics Finland. The Bank of Finland statistics replace Statistics Finland’s earlier statistical review ‘Financial statements of mutual funds and investment management companies’.
1 According to the Guideline of the European Central Bank (ECB/2007/9), investment funds are statistically classified into six different types: equity funds, bond funds, mixed funds, hedge funds, real estate funds and money market funds. This differs from Statistics Finland’s previous classification scheme.
Source: Financial statements of investment funds, Bank of Finland.
- Financial statements of investment funds, 2009 and key figures 1995–2009 (.xls)
- Key financial figures of fund management companies, 2009 (Financial Supervisory Authority)
More information:
Jyrki Lehtinen, tel. +358 10 831 2376, email: jyrki.lehtinen(at)bof.fi
Hermanni Teräväinen, tel. +358 10 831 2172, email: hermanni.teravainen(at)bof.fi
Income statement items for investment funds registered in Finland, by fund type, 2009,
EUR m
Equity funds |
Bond funds | Mixed funds | Real estate funds | Hedge funds | Investment funds total | Money market funds | Total | |
| RETURNS AND REVALUATIONS | 5 889 | 2 128 | 633 | 36 | 162 | 8 848 | 417 | 9 264 |
| Net income from securities | 5 365 | 1 593 | 547 | 31 | 92 | 7 628 | 176 | 7 804 |
| Capital gains | 1 125 | 542 | 122 | 3 | 1 016 | 2 809 | 82 | 2 891 |
| Capital losses | -2 798 | -662 | -237 | -29 | -1 062 | -4 787 | -396 | -5 183 |
| Unrealised value changes | 7 037 | 1 713 | 662 | 57 | 137 | 9 606 | 489 | 10 096 |
| Net income from derivative contracts | 55 | 16 | 10 | -1 | 16 | 96 | 0 | 95 |
| Capital gains | 169 | 621 | 139 | 2 | 342 | 1 273 | 4 | 1 278 |
| Capital losses | -81 | -564 | -117 | -1 | -333 | -1 096 | -5 | -1 100 |
| Unrealised value changes | -33 | -40 | -13 | -2 | 6 | -82 | 0 | -82 |
| Dividend income and income from fund shares | 351 | 3 | 34 | 5 | 5 | 397 | 0 | 397 |
| Interest income | 9 | 488 | 34 | 0 | 41 | 572 | 237 | 809 |
| Other income | 110 | 28 | 8 | 1 | 8 | 155 | 5 | 159 |
| EXPENSES | -327 | -100 | -40 | -2 | -43 | -512 | -43 | -555 |
| Fees1 | -227 | -92 | -36 | -1 | -22 | -377 | -39 | -417 |
| Other expenses2 | -101 | -9 | -4 | 0 | -21 | -135 | -3 | -138 |
| NET PROFIT / LOSS FOR THE FINANCIAL YEAR | 5 561 | 2 028 | 593 | 34 | 119 | 8 335 | 374 | 8 709 |
Balance sheet items for investment funds registered in Finland, by fund type, 2009, EUR m
Equity funds |
Bond funds | Mixed funds | Real estate funds | Hedge funds | Investment funds total |
Money market funds | Total | |
| TOTAL ASSETS | 19 927 | 17 339 | 4 043 | 136 | 1 996 | 43 440 | 11 771 | 55 211 |
| Securities at market value | 19 131 | 16 584 | 3 763 | 130 | 1 463 | 41 071 | 11 387 | 52 458 |
| Receivables3 | 796 | 755 | 280 | 6 | 532 | 2 369 | 384 | 2 753 |
| TOTAL LIABILITIES | 19 927 | 17 339 | 4 043 | 136 | 1 996 | 43 440 | 11 771 | 55 211 |
| Fund value 31 Dec | 19 687 | 17 281 | 4 020 | 135 | 1 692 | 42 815 | 11 725 | 54 540 |
| Net profit / loss for the financial year | 5 561 | 2 028 | 593 | 34 | 119 | 8 335 | 374 | 8 709 |
| Profit distribution | -21 | -70 | -4 | -1 | 0 | -96 | -10 | -106 |
| Redemptions of IF shares | -5 328 | -9 875 | -510 | -31 | -869 | -16 613 | -14 490 | -31 103 |
| Subscriptions of IF shares | 8 733 | 11 129 | 1 018 | 37 | 844 | 21 761 | 13 571 | 35 332 |
| Fund value 1 Jan | 10 740 | 14 069 | 2 923 | 96 | 1 599 | 29 427 | 12 280 | 41 707 |
| Current liabilities4 | 248 | 58 | 23 | 1 | 303 | 634 | 46 | 680 |
1 includes fees paid to fund management companies and custodians
2 includes interest expenses and other expenses
3 includes accounts receivable, other receivables, accrued income, as well as cash and bank deposits
4 includes accounts payable, accrued expenses, other liabilities
2 includes interest expenses and other expenses
3 includes accounts receivable, other receivables, accrued income, as well as cash and bank deposits
4 includes accounts payable, accrued expenses, other liabilities