Balance sheet items for investment funds registered in Finland, by fund type, 2011, EUR m1 includes fees paid to fund management companies and custodians
2 includes interest expenses and other expenses
3 includes accounts receivable, other receivables, accrued income, as well as cash and bank deposits
4 includes adjustments related to mergers and acquisitions, and other changes5 includes accounts payable, accrued expenses, other liabilities
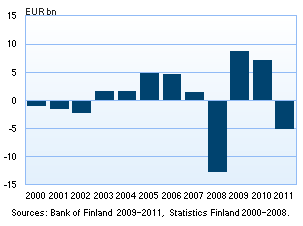
| Investment funds reported losses of EUR 5.0 billion for 2011 In 2011, the total result of investment funds registered in Finland deteriorated to a loss of EUR 5.0 billion. Total results of investment funds had been positive in the two previous years. However, the result was not as weak as in 2008, when investment funds reported losses of no less than EUR 12.7 billion. Only 26% of the Finnish investment funds reported a positive result for 2011, whereas the proportion had been 91% one year earlier. The negative total result of investment funds was mainly due to a sharp drop in equity prices. | |||||||
|---|---|---|---|---|---|---|---|
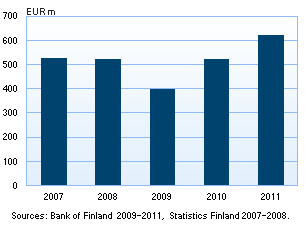
| Equity funds’ share of the aggregate loss of investment funds was by far the largest at EUR 4.8 billion. Equity funds were also the most significant fund category1 in terms of fund capital in 2011, so their impact on the total result of investment funds was large. Mixed funds also suffered from weak market developments and reported total losses of EUR 0.4 billion for the financial year. Only bond funds and money market funds reported positive total results for the financial year.Mainly the negative result was formed by unrealised value depreciation of investment funds’ security holdings, which was reported at a total of EUR 6.2 billion in 2011. In addition, the result of the financial year was weakened by investment funds’ increased expenses. Expenses totalled EUR 0.8 billion in 2011. The increased expenses were particularly attributable to other expenses (EUR 0.2 billion), which continued growing in the same way as in 2010.2 Fees paid to fund management companies and custodians, which make up most of all investment fund expenses, remained unchanged (EUR 0.6 billion) compared to 2010.The deterioration of the result of the financial year was in turn dampened by increased interest income, dividend income and income from fund shares. The reported interest income amounted to more than EUR 0.9 billion. Interest income was at the highest level in three years in 2011. Most of the reported interest income was recognised under bond funds (EUR 0.6 billion) and money market funds (EUR 0.2 billion). |
Net profit of investment funds, 2000-2011
|
||||||
Dividend income and income from fund shares (EUR 0.6 billion) totalled at EUR 0.1 billion above the 2010 level. The increased dividend income and income from fund shares were largely based on the dividends paid out in 2011 for the excellent 2010 result. The bulk of dividend income and income from fund shares received by investment funds (EUR 0.6 billion) went to equity funds. In addition, the result of the financial year was improved by gains on disposal of securities amounting to an annual net amount of EUR 0.4 billion. In 2011, the aggregate fund capital of Finnish investment funds shrank by EUR 6.5 billion and amounted to EUR 55.7 billion at year-end. Most of the fund capital contraction (77%) was due to the loss in the financial year. Furthermore, investors redeemed fund capital worth a net amount of EUR 1.4 billion during the year.3 Investment funds distributed profits of EUR 0.1 billion to their shareholders, as in 2010. At the end of 2011, there were 519 operating investment funds registered in Finland, administered by 35 fund management companies. The Bank of Finland annually publishes a statistical release ‘Financial statements of investment funds’. The data are collected directly from investment funds registered in Finland. The publication also relies on data derived from monthly balance sheet reporting by investment funds to the Bank of Finland. 1 According to a Guideline of the European Central Bank (ECB/2007/9), investment funds are classified into six statistical types: equity funds, bond funds, mixed funds, hedge funds, real estate funds and money market funds.2 Other expenses include, among other things, interest expenses and exchange rate losses due to converting foreign currency financial items into euro.3 In the statistics on financial statements of investment funds, subscriptions of investment fund shares include smaller adjustments due to other changes. Source: Financial statements of investment funds 2011, Bank of Finland.  Financial statements of investment funds, 2011 and key figures 1995-2011.xls Financial statements of investment funds, 2011 and key figures 1995-2011.xls | |||||||
| Income statement items for investment funds registered in Finland, by fund type, 2011, EUR m | |||||||
| Equity funds | Bond funds | Mixed funds | Real estate funds | Hedge funds | Money market funds | Total | |
| RETURNS AND REVALUATIONS | -4 246 | 197 | -358 | -20 | 17 | 193 | -4 217 |
| Net income from securities | -4 913 | -377 | -410 | -26 | -76 | -58 | -5 860 |
| Capital gains | 6 683 | ||||||
| Capital losses | -6 295 | ||||||
| Unrealised value changes | -5 118 | -509 | -465 | -24 | -31 | -99 | -6 247 |
| Net income from derivative contracts | -40 | -25 | -41 | 0 | -9 | -1 | -117 |
| Capital gains | 344 | 540 | 389 | 1 | 126 | 12 | 1 412 |
| Capital losses | -361 | -518 | -416 | -1 | -127 | -13 | -1 436 |
| Unrealised value changes | -23 | -47 | -14 | 0 | -8 | 0 | -92 |
| Dividend income and income from fund shares | 557 | 7 | 47 | 5 | 5 | 0 | 621 |
| Interest income | 8 | 569 | 32 | 0 | 86 | 247 | 941 |
| Other income | 142 | 24 | 14 | 0 | 11 | 6 | 197 |
| EXPENSES | -514 | -136 | -47 | -2 | -71 | -38 | -806 |
| Fees1 | -357 | -122 | -43 | -2 | -21 | -36 | -581 |
| Other expenses2 | -156 | -14 | -3 | 0 | -49 | -2 | -225 |
| NET PROFIT / LOSS FOR THE FINANCIAL YEAR | -4 760 | 62 | -405 | -22 | -54 | 155 | -5 024 |
|
Equity
funds
|
Bond funds |
Mixed funds
|
Real estate
funds
|
Hedge
funds
|
Money market funds | Total | |
| TOTAL ASSETS | 19 325 | 19 458 | 4 610 | 125 | 1 417 | 11 425 | 56 360 |
| Securities at market value | 18 595 | 18 121 | 4 253 | 120 | 1 098 | 10 926 | 53 204 |
| Receivables3 | 730 | 1 246 | 357 | 5 | 319 | 499 | 3 157 |
| TOTAL LIABILITIES | 19 325 | 19 458 | 4 610 | 125 | 1 417 | 11 425 | 56 360 |
| Fund value 31 Dec | 19 186 | 19 121 | 4 573 | 125 | 1 367 | 11 354 | 55 726 |
| Net profit / loss for the financial year | -4 760 | 62 | -405 | -22 | -54 | 155 | -5 024 |
| Profit distribution | -49 | -77 | -6 | -1 | 0 | -7 | -140 |
| Redemptions of IF shares | -11 669 | -11 461 | -927 | -63 | -994 | -11 596 | -36 710 |
| Subscriptions of IF shares4 | 10 276 | 10 266 | 1 058 | 56 | 1 110 | 12 583 | 35 348 |
| Fund value 1 Jan | 25 387 | 20 332 | 4 854 | 156 | 1 305 | 10 218 | 62 252 |
| Current liabilities5 | 140 | 337 | 37 | 0 | 50 | 70 | 635 |
More information:
Johanna Honkanen, tel. 010 831 2992, email: johanna.honkanen(at)bof.fi
Hermanni Teräväinen, tel. 010 831 2172, email: hermanni.teravainen(at)bof.fi