Finland's balance of payments
| Year 2009, EUR million |
November 2010, EUR million |
December 2010, EUR million |
Year 2010, EUR million | |
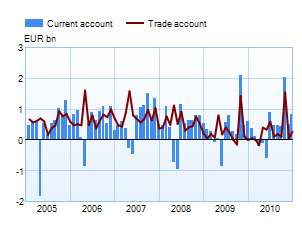
| Current account | 4,696 | 497 | 826 | 5,158 |
| Goods | 3,395 | 60 | 272 | 3,535 |
| Services | 1,329 | 258 | 270 | 1,502 |
| Income | 1,661 | 310 | 414 | 1,821 |
| Current transfers | -1,689 | -131 | -131 | -1,700 |
| Capital account | 145 | 12 | 11 | 144 |
| Financial account | 11,011 | 291 | -3,929 | -4,253 |
| Direct investment | -2,762 | 21 | -1,385 | -3,882 |
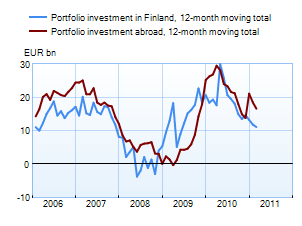
| Portfolio investment | -513 | 3,430 | -11,624 | -7,936 |
| Other investment | 12,669 | -3,692 | 8,780 | 6,262 |
| Reserve assets | -614 | 507 | 8 | 1,666 |
| Financial derivatives | 2,231 | 25 | 292 | -362 |
| Errors and omissions | -15,852 | -800 | 3,092 | -1,049 |
The statistics become final more than two years after the end of the reference year.
1 Data on trade in goods and services for 2008 and 2009 differ from Statistics Finland’s data due to different revision methods.
More information
Anne Turkkila tel. +358 10 831 2175, email firstname.lastname(at)bof.fi
The next balance of payments bulletin will be published at 10.00 am on 15 March 2011.


