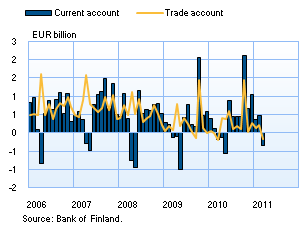
Current account turned negative in MarchThe current account posted a deficit of over EUR 0.3 bn in March 2011. A year earlier the current account deficit totalled EUR 0.2 bn. In BOP terms, the trade account posted a deficit of almost EUR 0.2 bn in March, the same as a year earlier. In the first quarter of 2011, the value of exports of goods increased by 31% compared with the first quarter of 2010, whereas the value of imports of goods increased by 28%. Finland’s exports of goods to non-euro area countries, such as Russia, Sweden and the United States, increased substantially in the first quarter of 2011. Growth in imports of goods has been more broad based, but is still largely concentrated on EU but also on Russia and Norway. The income account was almost in balance in March 2011 owing to outward dividend payments on portfolio investment. Outward dividend payments on portfolio investment usually occur in April and May. |
Finland's current and trade account
|
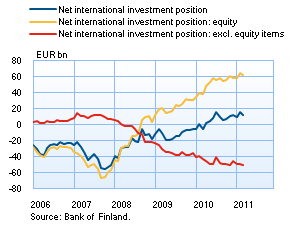
Finnish residents’ external assets exceeded external liabilitiesAt the end of March 2011, Finnish residents’ external (foreign) assets exceeded external liabilities by over EUR 12 bn. External assets totalled EUR 548 bn, and external liabilities were EUR 536 bn. Finnish residents’ external assets have increased by over EUR 100 bn from end-2009 to end-March 2011. The largest growth, almost EUR 90 bn, was recorded by monetary financial institutions (MFIs) and employment pension institutions. However, when equity items are excluded, Finnish residents’ external liabilities exceed external assets. At end-March 2011 the net international investment position excluding equity items was a negative EUR 50 bn. From end-2009 to end-March 2011, Finland’s negative position excluding equity items has grown by over EUR 14 bn. The majority of the growth is due to increased government borrowing. |
Finland's net international investment position
|
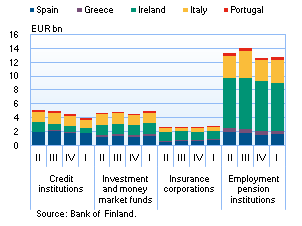
In connection with this BOP bulletin, new information (Table) is published on external assets of key Finnish investor sectors1 broken down by country. The data will be updated monthly. At the end of March 2011, Finnish key investor sectors’ main target countries for investment were the United Kingdom, Denmark and Sweden. The share of these countries in the sectors’ total stock of outward investment was EUR 191 bn, ie about 48%. Key investor sectors’ investment in GIIPS countries2 amounted to over EUR 24 bn at end-March 2011. GIIPS account for about 6% of the sectors’ total stock of investment. Within the GIIPS, the most investment was in Ireland, mainly in investment funds registered in Ireland. Investment funds use the money to invest in other countries.
1 Credit institutions, investment and money market funds, insurance corporations and employment pension institutions.
2 Greece, Ireland, Italy, Portugal and Spain.
|
Investment in GIIPS countries by key Finnish
|
Finnish residents repatriated capital from foreign portfolio investment in the first quarter of 2011Finnish residents’ foreign portfolio investment assets decreased by EUR 2.8 bn, while portfolio investment liabilities increased by EUR 1.3 bn in the first quarter of 2011. Finnish residents reduced their holdings of foreign debt securities but invested more in fund shares. Investment in fund shares increased by EUR 1.8 bn in the first quarter of 2011. Of the domestic investor sectors, employment pension institutions increased their foreign portfolio investment most, by about EUR 1.6 bn, whereas MFIs and the central government reduced their investments by about EUR 4.7 bn. Foreign investors increased their holdings of debt securities issued by banks, the sales of which abroad totalled EUR 2.9 bn. In contrast, foreign investors reduced their holdings of Finnish shares by about EUR 0.7 bn in the first quarter of 2011. Finnish non-financial corporations’ portfolio investment liabilities declined by about EUR 1.3 bn in the first quarter of 2011. The central government’s foreign portfolio investment liabilities declined by EUR 0.8 bn. Of the domestic sectors, only the MFIs recorded an increase in foreign portfolio investment liabilities in the first quarter of 2011. |
|
Finland's balance of payments
| Year 2010, EUR million |
February 2011, EUR million |
March 2011, EUR million |
12 month moving sum, EUR million | |
| Current account | 5,636 | 462 | -336 | 5,817 |
| Goods | 3,382 | 214 | -163 | 3,700 |
| Services | 2,151 | 22 | -34 | 1,955 |
| Income | 1,721 | 375 | 9 | 1,780 |
| Current transfers | -1,618 | -148 | -148 | -1,618 |
| Capital account | 184 | 15 | 15 | 184 |
| Financial account | -3,316 | 416 | 790 | -4,902 |
| Direct investment | -3,459 | -433 | -98 | -4,633 |
| Portfolio investment | -7,872 | 3,069 | 2,687 | -3,491 |
| Other investment | 6,716 | -2,593 | -990 | 3,217 |
| Reserve assets | 1,661 | 604 | -495 | 1,047 |
| Financial derivatives | -362 | -231 | -314 | -1,041 |
| Errors and omissions | -2,503 | -894 | -470 | -1,100 |
The statistics become final more than two years after the end of the reference year.
More information
Jaakko Suni tel. +358 10 831 2454, email firstname.lastname(at)bof.fi
The next balance of payments bulletin will be published at 10 am on 15 June 2011.