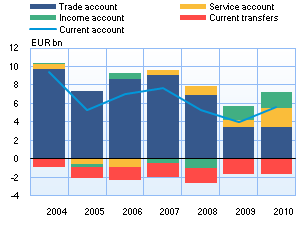
Surplus on services boosts current accountFinland’s current account surplus grew to EUR 5.6 billion in 2010, or approximately 3.1% of GDP. This was EUR 1.6 billion more than in 2009. Receipts in 2010 were up by around 9% on the previous year, and expenditures by around 8%. In BOP terms, there was a EUR 3.4 billion surplus on goods,1 more or less the same as in 2009. Both imports and exports were up by around 16% on the previous year. The higher price of oil pushed up import expenditures. Export receipts were boosted by growth in exports by the metal and forest industries and the chemical industry. In BOP terms, the goods account was about half the level of 2008. Services’ contribution to the current account figures increased substantially in 2010. Net receipts on the services account totalled EUR 2.2 billion. This is almost three times the figure for 2009, and more than ever before. In 2010, services accounted for 30% of the current account, compared with less than 20% in 2009 and just 6% in 2007. Income account flows, which include interest and dividends, were inward on net, in the amount of EUR 1.7 billion. There was a net outflow of EUR 1.5 billion in dividend payments on portfolio investment. In contrast, there was a net inflow of EUR 4.1 billion in income from direct investment, approximately EUR 0.3 billion more than in 2009. 1 The data under ‘Goods’ in the balance of payments statistics differ from the National Board of Customs’ foreign trade statistics due to freight and insurance cost adjustments: in BOP statistics, the share of foreign carriers and insurers is deducted from the Board of Customs' cif-based goods imports and entered under transportation and insurance costs. |
 |
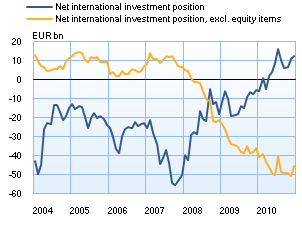
Finland’s net international investment position at the end of the yearAt the end of 2010, Finnish residents’ foreign assets were EUR 12 billion more than their liabilities. Assets totalled EUR 535 billion, while liabilities were EUR 523 billion. At the end of 2009, liabilities exceeded assets in the amount of EUR 6 billion, meaning assets grew faster than liabilities in 2010. If equity items are excluded, the relationship is reversed. At the end of 2010, foreign liabilities exceeded assets by EUR 46 billion. This represented an increase of approximately EUR 9 on one year earlier. The most significant increase in liabilities came from government-issued debt instruments. In Finland’s key sectors of investment, Finnish residents had assets in the GIIPS2 countries totalling EUR 24 billion at the end of 2010. This amounted to approximately 6% of these sectors’ total investment portfolio. More precise figures are provided in Table 13. 2 Greece, Ireland, Italy, Portugal and Spain. |
|
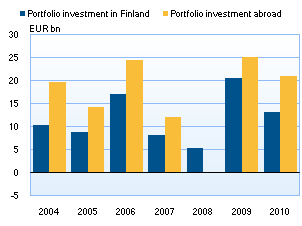
Capital flows in portfolio investment still buoyantThere was a net outflow of EUR 8 billion in portfolio investment in 2010. Finnish investors increased their foreign holdings by EUR 21 billion, which was admittedly EUR 4 billion less than the record set in 2009. In similar fashion, foreign investors increased their holdings in Finnish securities by EUR 13 billion, or EUR 7 billion less than the previous year. Of Finnish residents’ investments abroad, approximately one half were in bonds, which attracted almost EUR 11 billion. The rest went primarily into shares of investment funds registered abroad. The domestic investing sector that exported the most capital was the MFI sector, which accounted for almost 80% of the total outflow of capital. Investment funds registered in Finland (excl. money market funds) also substantially increased their investments abroad. The market value of Finnish holdings of foreign securities at the end of 2010 was EUR 207 billion. Bonds accounted for a little over half of this total, or 53%. Holdings by employee pension providers and other social security funds accounted for almost 40 % of the stock of investment, and MFI holdings for a little over a quarter. Capital inflows mainly comprised investments in debt securities issued by Finnish residents, of which net sales abroad altogether totalled EUR 12 billion. Most of these were government bonds and short-term government debt papers. In contrast, money market instruments issued by the MFI sector – mainly banks – were repurchased from abroad and redeemed. Net sales of investment fund shares abroad by investment funds registered in Finland totalled just under EUR 3 billion. Finnish companies’ equities were repatriated to the value of EUR 1.4 billion. The market value of inward portfolio investment stock at the end of 2010 was EUR 225 billion. Foreign residents’ investments in Finland were mainly in bonds, which accounted for a good half of the value of the stock of investment. Viewed according to the issuer’s sector, the corporate sector had the most securities-based debt, at EUR 78 billion. Foreign investors’ holdings in corporate sector equities had a market value of EUR 60 billion. |
 |
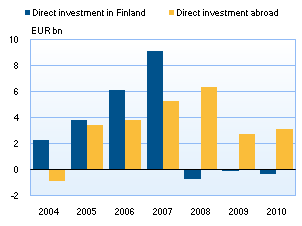
Direct inward investment remains lowThe flow of direct investment into Finland has remained at an exceptionally low level since 2008. Preliminary data on 2010 indicates that the inward flow of direct investment was negative in the amount of EUR 0.3 billion. In other words, the amount of capital exported from Finnish investment enterprises was greater than the amount of new inward capital invested. With the decline in international corporate acquisitions and mergers, there has not been a substantial inflow of new direct investment into Finland, nor have foreign companies significantly increased the funding of their existing units in Finland. Moreover, the weakening results of investment enterprises has been reflected in the level of reinvested earnings, which has also served to reduce the flow of investment. A negative or close-to-zero investment flow does not, however, unambiguously mean a total standstill in investment activity. In 2010, foreign companies increased the equity financing of their units in Finland by EUR 1.8 billion, almost as much as in the two previous years added together. On the other hand, non-equity capital to the value of EUR 2.2 billion was exported from the Finnish units of foreign companies (primarily in the form of intra-group loans). The outward flow of direct investment in 2010 was approximately EUR 3.1 billion, or EUR 0.4 billion more than the previous year. Finnish companies boosted the equity capital of their foreign units by EUR 4.5 billion and imported EUR 1.4 billion of non-equity capital. In this respect, 2010 was a rather normal year, as Finnish companies also fund the activities of their domestic units via their finance units situated abroad. Overall, there was a net capital outflow of EUR 3.5 billion in direct investment in 2010. |
|
Finland’s balance of payments, January 2011
|
Finland's balance of payments
| Year 2010, EUR million |
December 2010, EUR million |
January 2011, EUR million |
12 month moving sum, EUR million | |
| Current account | 5,636 | 1,036 | 388 | 5,640 |
| Goods | 3,382 | 270 | 150 | 3,475 |
| Services | 2,151 | 462 | 18 | 2,083 |
| Income | 1,721 | 405 | 369 | 1,701 |
| Current transfers | -1,618 | -100 | -148 | -1,618 |
| Capital account | 184 | 14 | 15 | 184 |
| Financial account | -3,316 | -3,778 | 55 | -5,203 |
| Direct investment | -3,459 | -1,048 | -309 | -3,772 |
| Portfolio investment | -7,872 | -12,054 | -1,708 | -6,778 |
| Other investment | 6,716 | 9,025 | 2,800 | 5,542 |
| Reserve assets | 1,661 | 8 | -680 | 301 |
| Financial derivatives | -362 | 292 | -48 | -497 |
| Errors and omissions | -2,503 | 2,728 | -458 | -621 |
More information
Anne Turkkila tel. +358 10 831 2175, and Jaakko Suni tel. +358 10 831 2454, email firstname.lastname(at)bof.fi
The next balance of payments bulletin will be published at 10.00 am on 15 April 2011.

