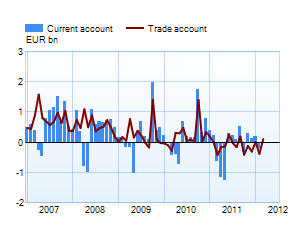
Current account remained in deficit in first quarter of 2012The current account fell into deficit in 2011 and remained that way at the beginning of 2012. However, in March the current account was close to balance. The trade balance according to the balance of payments1 was EUR 0.3 bn in deficit in the first quarter of 2012, while a year earlier it was EUR 0.2 bn in deficit. The data on services and current transfers in the first quarter of 2012 are preliminary, but based on them as a whole the deficit of the current account increased although the balance for services stood EUR 0.2 bn in surplus. The income balance was EUR 0.4 bn in surplus. 1 The data under 'Goods' in the balance of payments statistics differ from the National Board of Customs' foreign trade statistics. Freight and insurance costs, which appear in BOP service expenditures, are deducted from the National Board of Customs' cif-based goods imports. Goods produced in ports, including eg fuel, are added to both imports and exports. |
 |
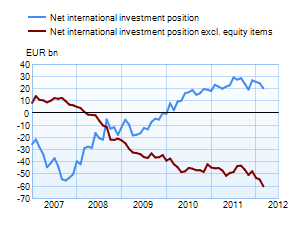
External debt continued to increaseThe net international investment position2 is a stock variable corresponding to financial accounts that illustrates the indebtedness of different sectors of the economy towards the rest of the world. The net international investment position reflects, in addition to investment flows, also revaluation adjustments for example share prices and foreign exchange rates. In comparing the investment position to the current account, attention must also be paid to errors and omissions. Finland’s net international investment position in the first quarter of 2012 was EUR 20 bn, meaning that net assets exceeded liabilities. The net liabilities has turned into assets at the end of 2009 and has grown steadily ever since. Equity items within the net international investment position amounted to EUR 80 bn at end-2012. Equity items grew larger than external debt in 2008. A key factor underlying the growth is a reduction in equity capital of the non-financial corporation sector, which in turn reflects the decline of domestic share prices. The largest proportion of the net assets is held through investment fund shares by employment pension institutions and other social security funds, whose net equity assets amounted to EUR 55 bn at end-March 2012. External debt, comprising different interest-related instruments such as loans, debt securities and derivatives, has increased since 2008 and has exceeded the level of the 1990s. External debt amounted to EUR 60 bn at end-March. Net government debt has increased by EUR 31 bn since 2008. The government’s net debt in the form of bonds has also increased. 2 The net figure is calculated as gross assets minus liabilities. |
 |
Finland's balance of payments
| Year 2011, EUR million |
February 2012, EUR million |
March 2012, EUR million |
12 month moving sum, EUR million | |
| Current account | -1,272 | -211 | -42 | -1,311 |
| Goods | -1,115 | -381 | 102 | -1,149 |
| Services | 926 | 82 | 68 | 1,020 |
| Income | 552 | 238 | -63 | 455 |
| Current transfers | -1,636 | -150 | -149 | -1,636 |
| Capital account | 178 | 13 | 15 | 175 |
| Financial account | 9,504 | 3,582 | 2,630 | 20,599 |
| Direct investment | -3,858 | -84 | -531 | -4,025 |
| Portfolio investment | 9,614 | 1,466 | -4,246 | 4,829 |
| Other investment | 3,445 | 1,900 | 8,185 | 18,341 |
| Reserve assets | -320 | 18 | -79 | -4 |
| Financial derivatives | 623 | 281 | -699 | 1,458 |
| Errors and omissions | -8,410 | -3,384 | -2,603 | -19,463 |
More information Maria Huhtaniska-Montiel tel. +358 10 831 2534, and Anne Turkkila tel. +358 10 831 2175, email firstname.lastname(at)bof.fi
The next balance of payments bulletin will be published at 10.00 am on 15 June 2012.