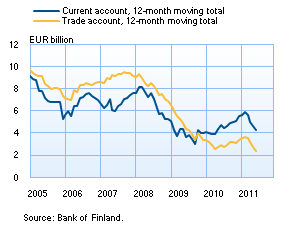
Current accountThe current account for the first half of 2011 showed a deficit of EUR 0.9 bn, compared to a surplus of EUR 0.5 bn for the year-earlier period. In June 2011, the current account posted a surplus of EUR 0.5 bn, compared to a surplus of EUR 0.9 bn a year earlier. For the 12 months July 2010 – June 2011, there was a current account surplus of EUR 4.2 bn, which was EUR 0.6 bn less than for the 12 months to June 2010.
|
Current account and trade account
|
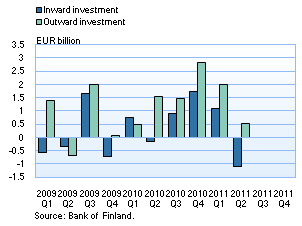
Dividend payments eroded direct investment flowsIn the second quarter of 2011, the flow of Finnish direct investment abroad amounted to EUR 0.5 bn, which was about one billion less than in the year-earlier period. The inflow of direct investment was a negative EUR 1.1 bn, as foreign investors withdrew, on net, capital from Finland. Compared to the year-earlier period Finnish direct investment inflows decreased by about EUR 1 bn. The contraction of direct investment inflows and outflows was primarily due to recorded dividend payments, which reduce the period’s reinvested earnings. According to a preliminary estimate, dividends paid on outward and inward direct investment each increased by about EUR 1.5 bn compared to the corresponding period in 2010.
|
Direct investment, net capital flows
|
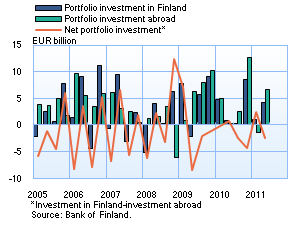
Capital flows for portfolio investment were in balance in the first half of 2011In January–June 2011, Finnish investors’ net purchases of foreign securities totalled EUR 5.3 bn, while foreign investors’ net purchases of Finnish securities amounted to EUR 5.2 bn; hence the near balance in portfolio investment flows. In quarterly terms, however, net investment flows diverged in that there was a capital inflow of EUR 2.5 bn in the first quarter of 2011 and an equal-sized capital outflow in the second quarter. The bulk of Finnish portfolio investment was in shares of investment funds registered abroad, which amounted to about EUR 5.0 bn in the first half of 2011. Foreign bond holdings increased by EUR 3.2 bn, whereas investment in shares and money market paper fell by EUR 1.0 bn and EUR 1.8 bn, respectively. Of the domestic investor sectors, employment pension and other social security funds accounted for the largest capital outflows, having increased their foreign portfolio investment by EUR 4.3 bn. Capital outflows of monetary financial institutions (MFIs) amounted to EUR 2.6 bn. The central government reduced its security holdings by EUR 2.2 bn. The great majority of Finnish securities sold to foreign investors comprised debt securities issued by Finnish MFIs. These net sales abroad totalled EUR 5.8 bn, virtually all of it in bonds. Although net sales abroad of Finnish government bonds increased to EUR 4.7 in the first half of 2011, the central government’s foreign portfolio liabilities contracted by EUR 0.8 bn, as the government redeemed a considerable amount – EUR 5.6 bn – of short-term debt instruments. Net sales of Finnish shares amounted to just EUR 0.6 bn, and foreign investors reduced their shareholdings of investment funds registered in Finland by EUR 0.3 bn. |
Portfolio investment, net flows
|
Foreign assetsAt the end of June 2011, Finnish residents’ foreign assets exceeded foreign liabilities by EUR 20 bn. Gross assets totalled EUR 553 bn and gross liabilities were EUR 533 bn. For non-financial corporations, MFIs, the central government and local government, external liabilities exceeded external assets. The opposite was true for other financial institutions, employment pension funds and households. At the end of June 2011, Finnish residents’ portfolio investment liabilities exceeded portfolio investment assets by EUR 7 bn. Other liabilities (loans, deposits and trade credits) also exceeded other assets, in the amount of EUR 22 bn. By contrast, direct investment assets exceeded direct investment liabilities by EUR 38 bn. At the end of June 2011, Finland’s net international investment position (= gross liabilities – gross assets) excluding equity items was a negative EUR 51 bn. |
|
Finland's balance of payments
| Year 2010, EUR million |
Maj 2011, EUR million |
June 2011, EUR million |
12 month moving sum, EUR million | |
| Current account | 5,574 | -918 | 476 | 4,234 |
| Goods | 3,352 | -11 | 228 | 2,404 |
| Services | 2,131 | 7 | 24 | 1,889 |
| Income | 1,723 | -766 | 372 | 1,508 |
| Current transfers | -1,632 | -148 | -148 | -1,567 |
| Capital account | 178 | 13 | 13 | 172 |
| Financial account | -1,231 | 3,844 | -1,145 | -594 |
| Direct investment | -3,073 | 891 | -1,148 | -4,239 |
| Portfolio investment | -6,158 | 1,102 | 1,597 | -6,747 |
| Other investment | 6,702 | 1,857 | -1,914 | 9,889 |
| Reserve assets | 1,661 | -253 | 39 | 49 |
| Financial derivatives | -362 | 247 | 281 | 455 |
| Errors and omissions | -4,521 | -2,939 | 656 | -3,812 |
More information
Anne Turkkila tel. +358 10 831 2175, email firstname.lastname(at)bof.fi
The next balance of payments bulletin will be published at 10.00 am on 15 September 2011.