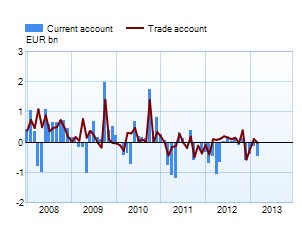
Current account
|
 |
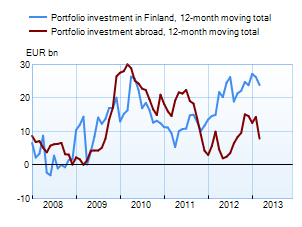
Financial accountThere was net capital inflow of EUR 1.2 bn.
|
 |
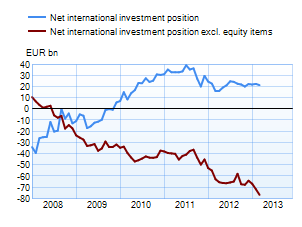
Net international investment position at end-AprilForeign assets exceeded foreign liabilities by EUR 20 bn.
Net international investment position – excluding equity items – was a negative EUR 79 bn. 1 The data under ‘Goods’ in the balance of payments statistics differ from the National Board of Customs’ foreign trade statistics. Freight and insurance costs, which appear in balance of payments statistics as services expenditure, are deducted from the National Board of Customs’ cif-based goods imports. Goods produced in ports, including eg fuel, are added to both imports and exports. |
 |
Finland's balance of payments
| Year 2012, EUR million |
March 2013, EUR million |
April 2013, EUR million |
12 month moving sum, EUR million | |
| Current account | -3,423 | -344 | -1,422 | -2,855 |
| Goods | 194 | -12 | 173 | 652 |
| Services | -945 | 154 | -57 | 232 |
| Income | -1,317 | -191 | -1,525 | -1,959 |
| Current transfers | -1,354 | -295 | -14 | -1,779 |
| Capital account | 198 | 16 | 16 | 196 |
| Financial account | 15,803 | 4,503 | 1,161 | 6,447 |
| Direct investment | -5,032 | -22 | -470 | -5,580 |
| Portfolio investment | 9,839 | 1,959 | -506 | 9,797 |
| Other investment | 10,890 | 3,372 | 1,688 | 1,674 |
| Reserve assets | -494 | -171 | 48 | 34 |
| Financial derivatives | 600 | -635 | 402 | 522 |
| Errors and omissions | -12,579 | -4,175 | 244 | -3,789 |
More information Anne Turkkila tel. +358 10 831 2175, and Mira Malhotra tel. +358 10 831 2257, email firstname.lastname(at)bof.fi