Finland imported capital in 2012 in the form of portfolio and other investment | ||||||||||||||||||||||||||||||||||||||||||||||||||||||||||||||||||||||
The increase of EUR 23.8 bn in portfolio investment liabilities in 2012 was mainly due to foreign investors’ purchases of long-term bonds issued by Finnish monetary financial institutions (MFIs), the central government and non-financial corporations. The EUR 14.5 bn increase in portfolio investment assets in 2012 resulted from investments in foreign long-term bonds by Finnish MFIs and Finnish-registered investment funds, as well as employment pension funds’ and other social security funds’ investments in foreign fund shares. Other investment was EUR 10.9 bn inward on net in 2012, compared to just EUR 1.4 bn in 2011. Other investment liabilities increased by EUR 14.2 bn in 2012, mainly due to foreign investments in Finnish MFIs. | ||||||||||||||||||||||||||||||||||||||||||||||||||||||||||||||||||||||
Inward direct investment contracted sharply again, after a modest recovery during the last two years | ||||||||||||||||||||||||||||||||||||||||||||||||||||||||||||||||||||||
Following the financial crisis that started in 2008, FDI flows into Finland, excluding pass-throughs, have remained much smaller than in previous years. In 2012 FDI inflows turned down again, after a few years of modest recovery. In the 2000s, FDI flows into Finland have generally followed the global patterns. Investment flows into developed countries also contracted sharply in 2012. According to preliminary data, Finland’s FDI outflows amounted to EUR 3.5 bn in 2012, which was roughly the same as in the previous year. Excluding pass-throughs, Finland’s outward FDI was EUR 1.1 bn higher than in the previous year. The financial crisis of 2008 has not been reflected in FDI flows from Finland to the same extent as FDI flows into Finland. In 2008–2011, Finland’s outward FDI was higher on average than in the years prior to the crisis. 1 Pass-through investment refers to investment where a domestic investment enterprise receives capital from a foreign direct investor and immediately reinvests it in its own direct investment enterprises abroad. Pass-through funds simultaneously increase both inward and outward FDI. In 2012 pass-through investment was negative, in the amount of EUR 0.8 bn. In other words, foreign investors relocated some of their outward FDI through Finland, which reduced Finland’s inward and outward FDI. | ||||||||||||||||||||||||||||||||||||||||||||||||||||||||||||||||||||||
Current account continued to post a deficit | ||||||||||||||||||||||||||||||||||||||||||||||||||||||||||||||||||||||
By contrast, foreign trade in services shifted to show a deficit of EUR 0.9 bn, after having posted a surplus for several years. Net receipts from other services decreased to EUR 1.8 bn, from EUR 3.4 bn still in 2011. Travel expenditure amounted to EUR 0.5 bn on net in 2012. The balance of tourism deteriorated in the 2000s until 2009, after which it has improved by about 0.2 bn a year. The deficit on the income account grew to EUR 1.3 bn in 2012. Net interest payments on portfolio investment totalled EUR 1.7 bn, compared to EUR 1.2 bn a year earlier. Net dividend payments amounted to EUR 1.2 bn, which was EUR 0.4 billion less than in 2011. 2 Balance of payments goods data differ from the National Board of Customs’ foreign trade statistics. For BOP purposes, freight and insurance costs are deducted from the National Board of Customs’ cif-based goods imports and appear as service expenditures. Goods produced in ports, which includes fuel, are added to both imports and exports.
Appendix: Revisions improve balance of payments Finland's balance of payments
More information Anne Turkkila tel. +358 10 831 2175 and Pauliina Turunen tel. +358 10 831 2457 email firstname.lastname(at)bof.fi |
Finland imported capital in 2012 in the form of portfolio and other investment
Balance of payments - Older news
Statistics
Wednesday 27 March 2013, 10:00 AM
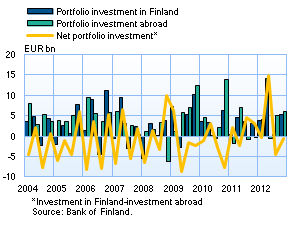 Finland’s net portfolio investment was EUR 9.2 bn inward in 2012, up slightly on the previous year.
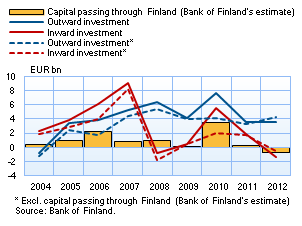 In 2012 foreign investors’ capital injections into Finnish enterprises continued to lag behind repatriations of capital. Preliminary data thus indicate that investment capital was relocated abroad on net, in the amount of EUR 1.4 bn. A year earlier net foreign direct investment (FDI) was EUR 1.9 bn inward. Excluding the impact of capital passing through Finland1, foreign investors withdrew capital in the amount of EUR 0.6 bn from Finland; in 2011 they brought EUR 1.7 bn of capital into Finland.
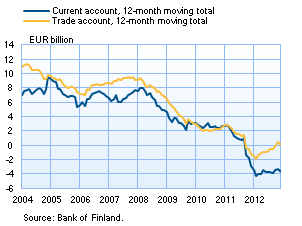 The current account deficit increased by EUR 0.7 bn from a year earlier, to EUR 3.6 bn in 2012. However, in balance of payments (BOP) terms, the trade account2 posted a surplus of EUR 0.2 bn, compared to a deficit of EUR 1.3 bn a year earlier.